Edge LLM Bench: which local model fits which machine
A FastAPI + Ollama backend that benchmarks the LLMs already installed on a machine — TTFT, tokens/sec, latency, peak RAM, MMLU accuracy — and recommends the best one for the hardware you actually have. Controlled from an Android app over Wi-Fi.
- llm
- benchmarking
- fastapi
- ollama
- flutter
"Which model should I actually run on this laptop?" is the question every local-LLM user eventually asks — and the honest answer is always it depends. Depends on free RAM, on how much first-token latency you can tolerate, on whether you're chatting or batch-processing. Blog posts and leaderboards quote numbers from hardware you don't own. So we stopped guessing and measured it.
Edge LLM Bench is what came out of that: a benchmarking platform that detects the host's hardware, runs every Ollama model already installed on it through a fixed prompt set, records speed, memory and answer quality, then recommends the best model for that machine and that workload. The whole thing is controlled from an Android app sitting on the same Wi-Fi network.
The architecture
Two halves, split across branches and merged via PRs:
- Laptop backend — Python FastAPI service that wraps Ollama. Hardware detection, benchmark engine, metrics collector, MMLU evaluator, and the recommendation engine live here.
- Android client — Flutter app: run & compare, benchmark runner, recommendation view, CSV/JSON export.
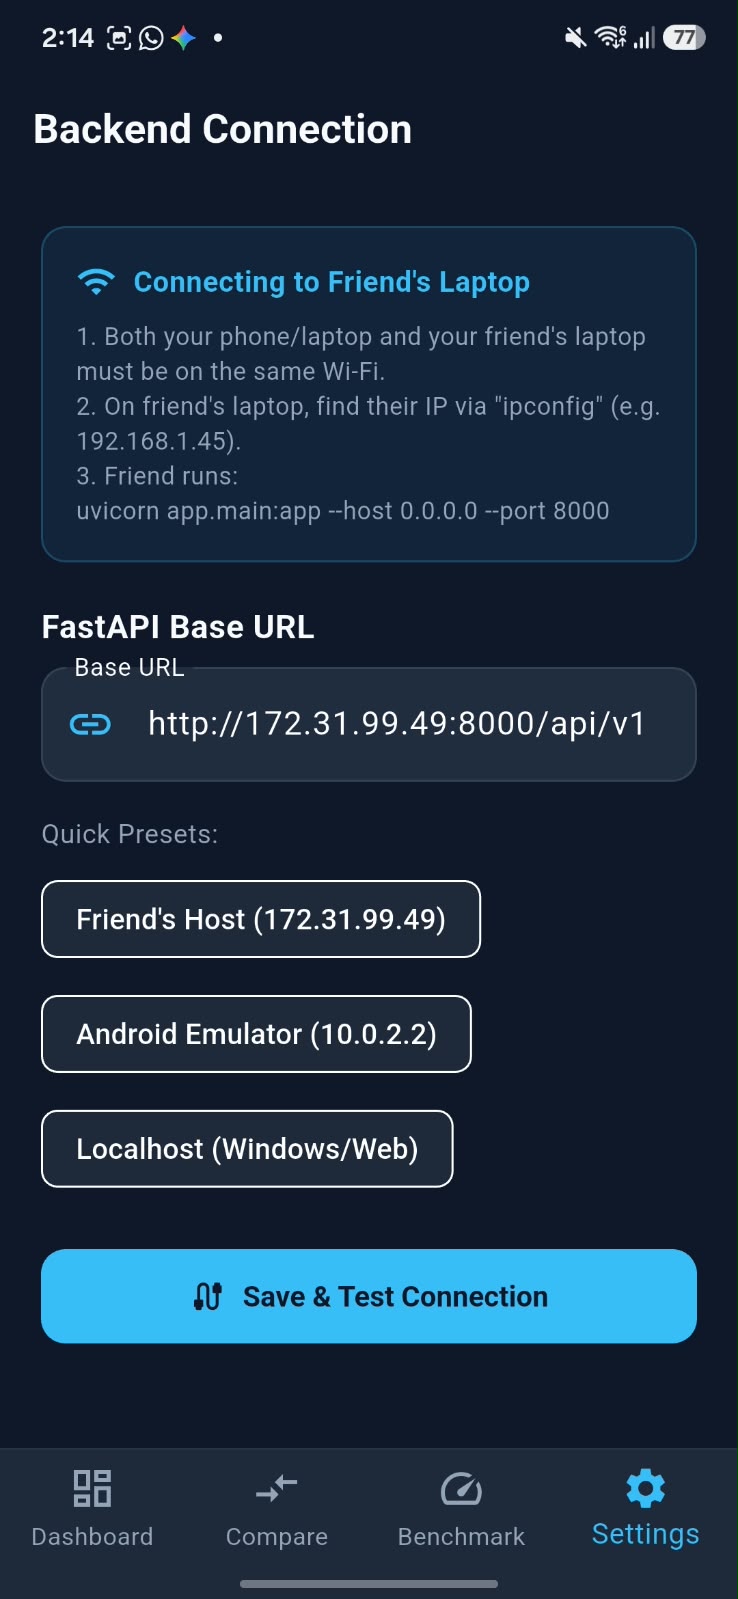
The phone talks to the laptop over HTTP (http://<lan-ip>:8000/api/v1), which
means you can start a twenty-minute benchmark from your desk and watch progress
from anywhere in the room. There's a settings screen with presets for common
setups — friend's laptop, Android emulator (10.0.2.2), localhost — because
fighting LAN IPs mid-hackathon is not anyone's idea of a good time.
Reading the dashboard
The home screen answers three questions at a glance: is the backend alive, what am I running on, and what should I use.
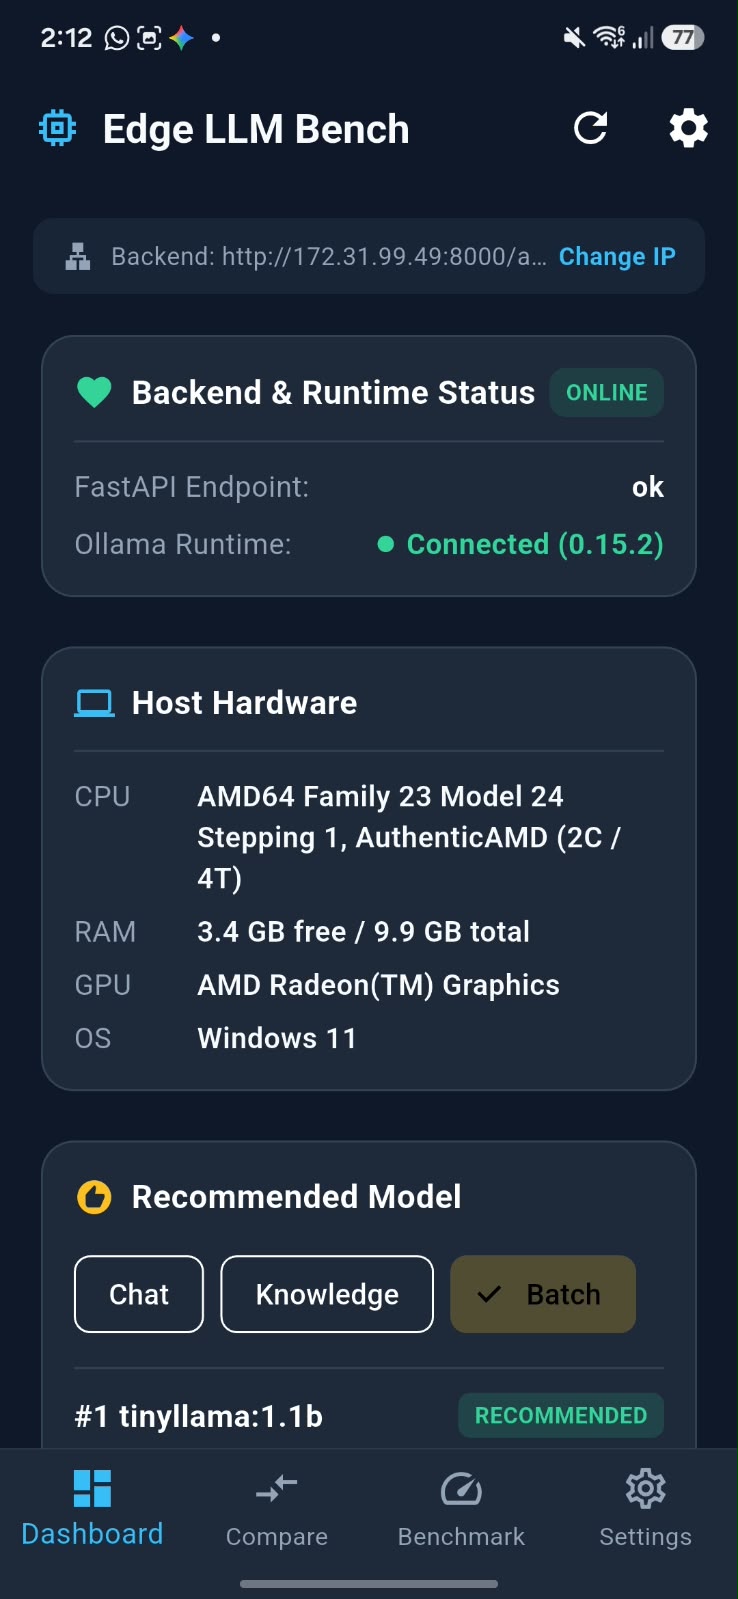
The hardware panel is honest about what it finds — CPU family, free vs. total RAM, GPU, OS. Our test machine is a modest AMD64 box with 2 cores / 4 threads and about 9.9 GB of RAM, exactly the kind of hardware where model choice actually matters.
The recommendation panel is the point of the whole project. Pick a workload — Chat, Knowledge or Batch — and it ranks the installed models by a weighted score:
score = w_q × accuracy_norm + w_s × tps_norm − w_l × TTFT_norm
with a hard filter that nothing recommending a model whose peak RAM exceeds 60%
of free memory. Chat weights speed heavily (0.6), Knowledge flips to accuracy
(0.6), Batch sits at throughput (0.8). On our machine, tinyllama:1.1b won the
batch workload at 8.6 tok/s — not because it's the smartest model in the
library, but because it's the fastest one that fits.
The model library
The backend enumerates what Ollama has actually pulled — no idealized model list. Seven models were installed during our testing run:
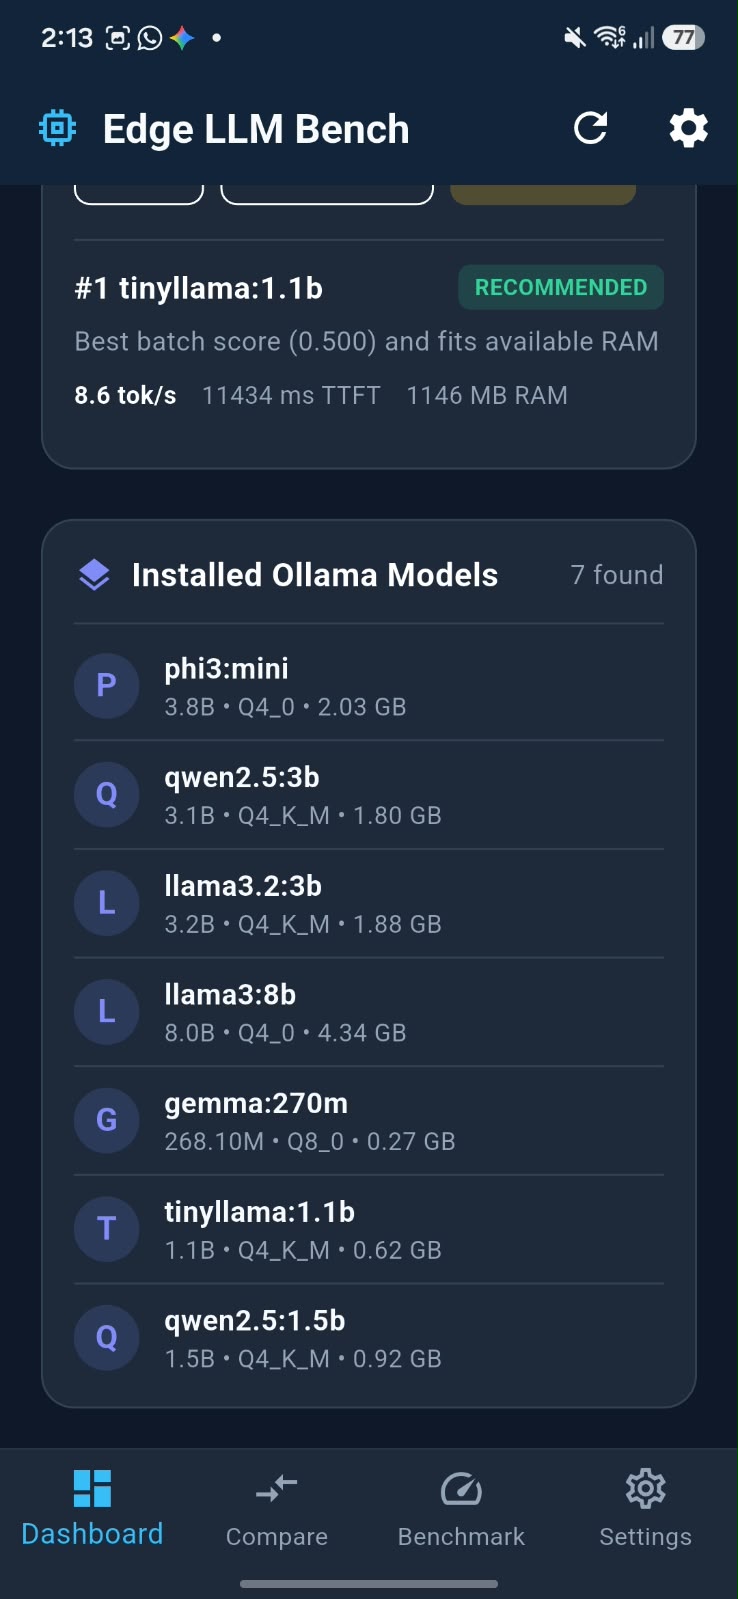
Each row shows parameter count, quantization and on-disk size — the three
numbers you need before deciding whether a model is even worth benchmarking on
a small machine. gemma:270m at 0.27 GB next to llama3:8b at 4.34 GB is a
reminder of how wide the "small model" category really is.
Run & Compare
The comparison screen is where the methodology gets enforced. Select two or more models, write the prompt, set temperature and token budget:
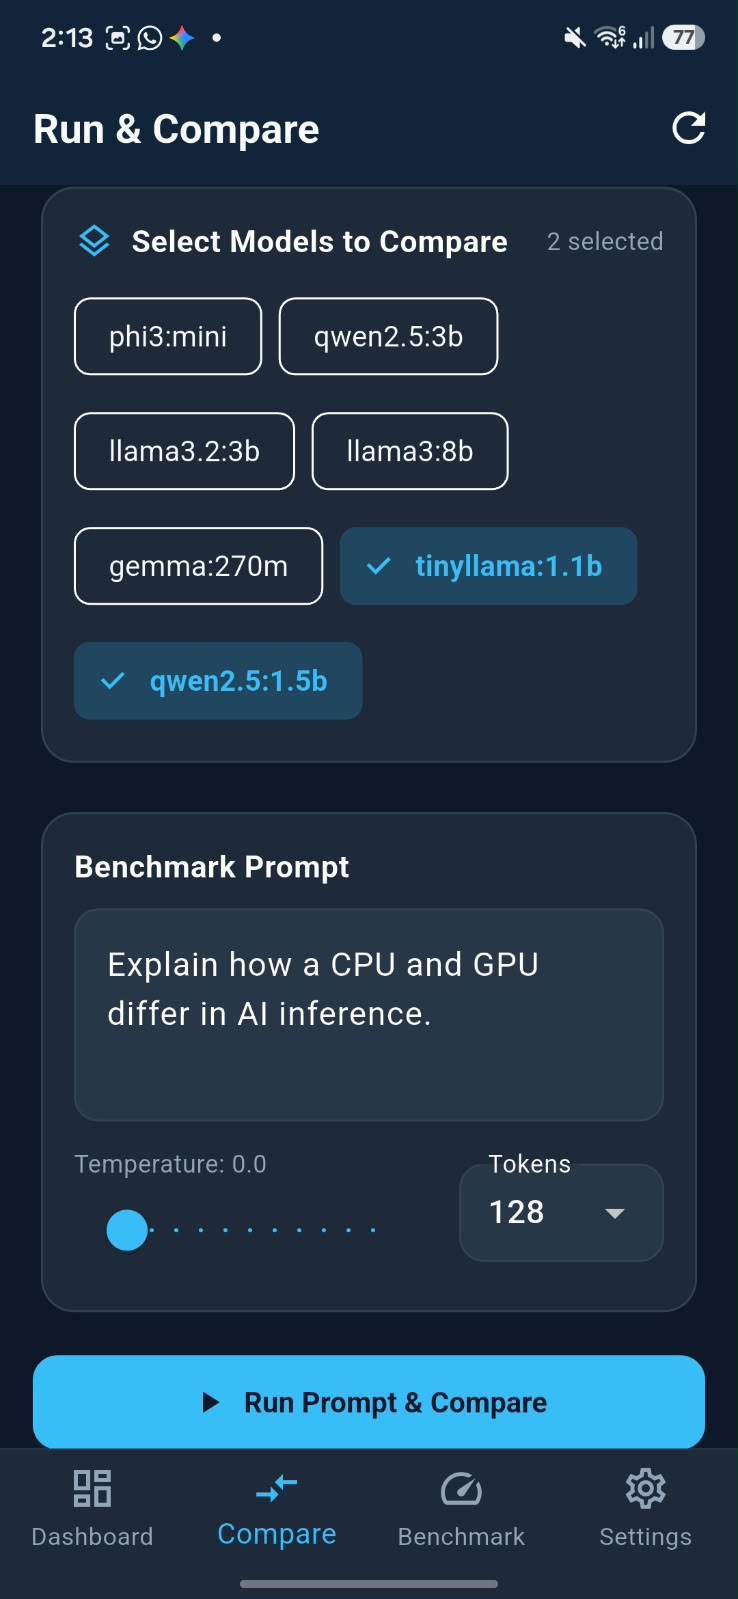
Temperature 0.0 for determinism, fixed token count so the comparison is fair. Then each model answers the same prompt and the results come back side by side, each card carrying the four numbers that matter — TTFT, latency, peak RAM, tokens generated:
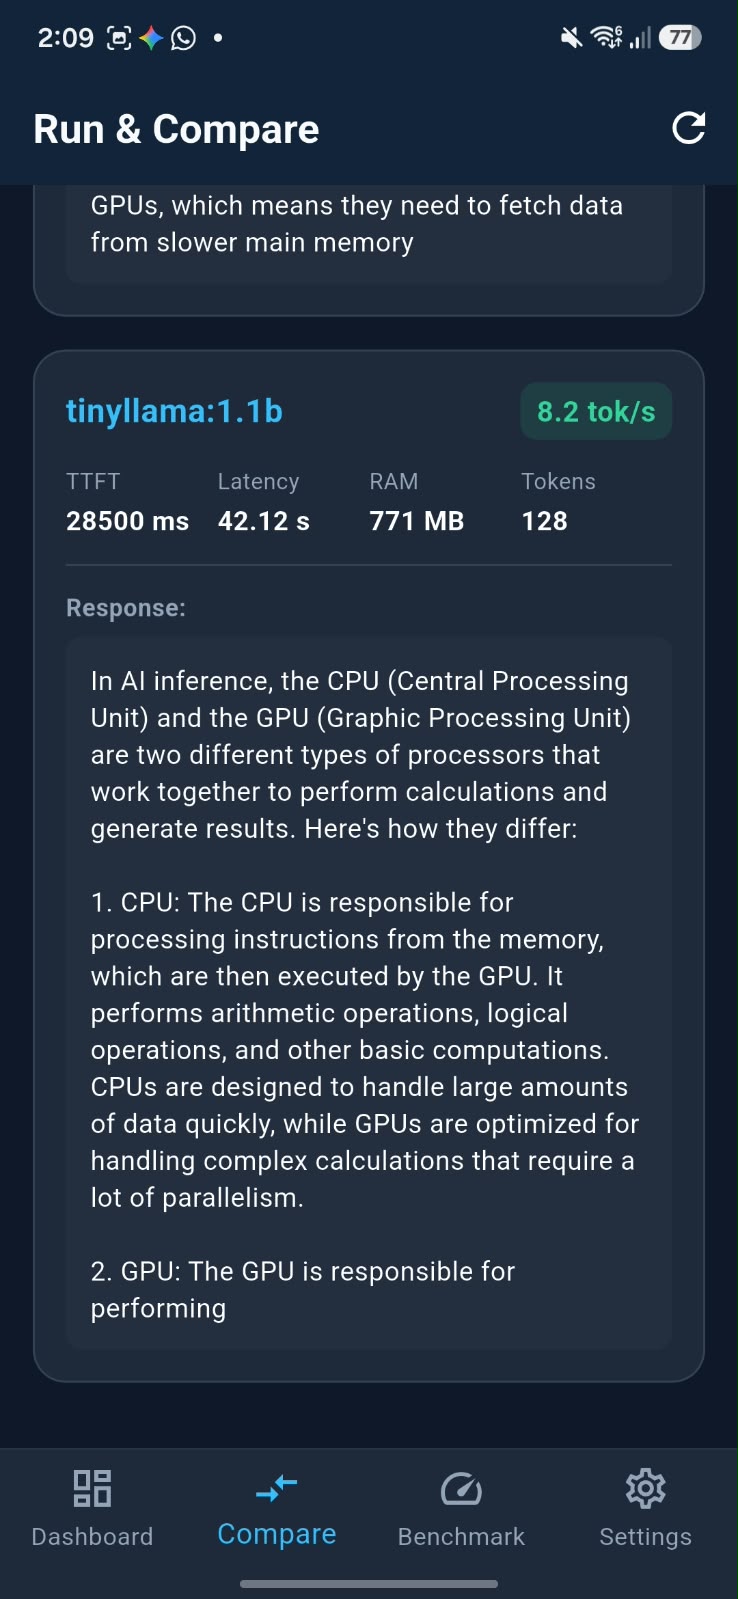
A real result from our test machine: tinyllama:1.1b answered at 8.2 tok/s
with 28.5s time-to-first-token and 771 MB peak RAM, while qwen2.5:1.5b — a
smarter model — crawled at 5.8 tok/s with a 58.6s TTFT and burned 1785 MB. On
12 GB of shared-memory hardware, that gap is the difference between usable and
not.
The full benchmark suite
For rigorous numbers, the benchmark suite runs the whole library through 8 fixed prompts (QA, summarization, code, reasoning) with a discarded warm-up run, 5 measured repeats each, and reports mean, std, p50, p95 and 95% confidence intervals. Quality is scored on a 200-question MMLU subset — 10 subjects × 20 questions — with exact-match grading, so speed numbers come with an honesty check attached. A model that's fast because it's confidently wrong shouldn't win the Knowledge workload, and the weighted score is how that gets caught.
Everything exports as CSV/JSON for whoever wants to do further analysis.
What I'd do differently
- GPU utilization is measured but unused. The iGPU on our test machine never entered inference. ROCm on a 2GB-iGPU laptop is a fight for another day, but the metrics pipeline should surface why a GPU wasn't used, not just report zero.
- The MMLU subset is small. 200 questions separates "fast and shallow" from "slow and accurate", but the confidence intervals on 3B models overlap more than we'd like. 500+ questions would settle it.
- Discovery is LAN-only by design, which was right for the hackathon but means no remote results. A small tunnel or token-authenticated relay would make results postable.
The repo is private for now — the methodology and the numbers are what matter for this writeup, and the code is going through another round of cleanup before it goes public.
Built with TamilSelvan (Flutter client); I owned the backend, benchmark engine and recommendation logic.
Filed under Sabarish R — Security & AI Notes.